2019.09.23
chart.js 페이지에 설명이 잘 나와있다
Chart.js | Open source HTML5 Charts for your website
New in 2.0 New chart axis types Plot complex, sparse datasets on date time, logarithmic or even entirely custom scales with ease.
www.chartjs.org
차트가 그려질 html에 canvas태그로 영역 설정
|
1
2
|
<!-- charts.js -->
<canvas id="myChart"></canvas>
|
차트 script
|
1
2
3
4
5
6
7
8
9
10
11
12
13
14
15
16
17
18
19
20
21
22
23
24
25
26
27
28
29
30
31
32
33
34
35
36
37
38
39
40
41
42
43
44
45
|
<!-- charts.js script-->
<script th:inline="javascript">
var ctx = document.getElementById('myChart').getContext('2d');
var utilityChart = new Chart(ctx, {
// The type of chart we want to create
type: 'bar',
// The data for our dataset
data: {
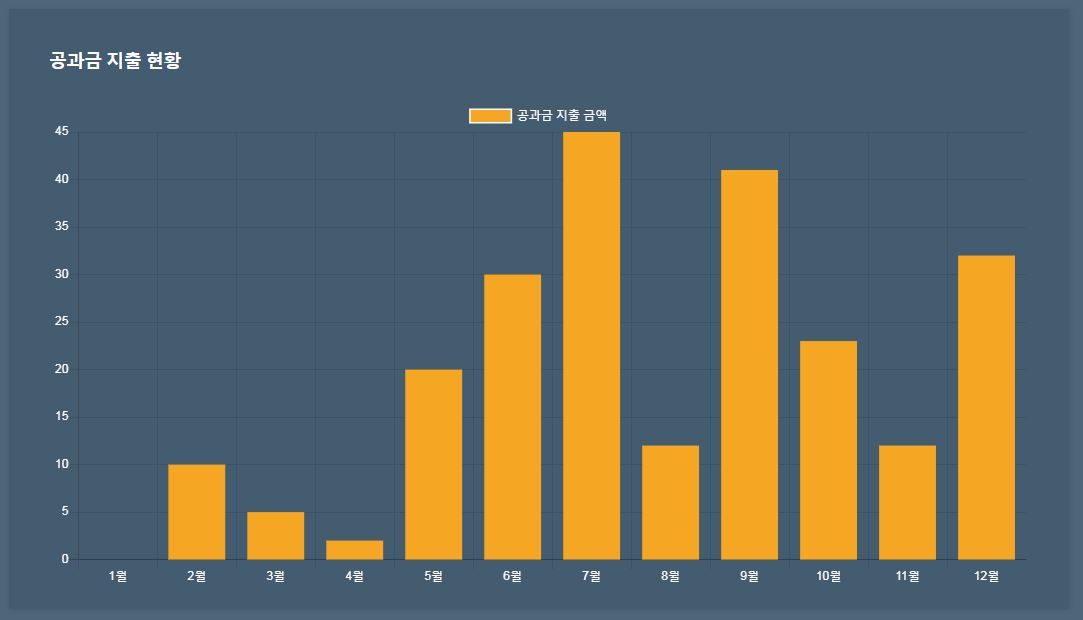
labels: ['1월', '2월', '3월', '4월', '5월', '6월', '7월','8월','9월','10월','11월','12월'],
datasets: [{
label: '공과금 지출 금액',
backgroundColor: 'rgb(245, 166, 35)',
borderColor: 'rgb(255, 255, 255)',
data: [0, 10, 5, 2, 20, 30, 45, 12, 41, 23, 12, 32]
}]
},
// Configuration options
options: {
legend: {
labels: {
fontColor: 'white' // label color
}
},
scales: {
// y축
yAxes: [{
ticks: {
beginAtZero:false,
fontColor:'white' // y축 폰트 color
}
}],
// x축
xAxes: [{
ticks: {
beginAtZero:false,
fontColor:'white' // x축 폰트 color
}
}]
}
}
});
</script>
|
'교육 > Java Script' 카테고리의 다른 글
| #96 jQuery 숫자 판별 isNaN (0) | 2019.10.01 |
|---|---|
| #94 jQuery 페이지 전환 후 정적 select 값 고정 (0) | 2019.09.27 |
| #74 Java Script 기상청 API 활용 (0) | 2019.08.28 |
| #70 Java Script ajax 기본 사용 (0) | 2019.08.21 |
| #67 Java Script jQuery 기본적인 API 예제 (0) | 2019.08.16 |